Maybe my bar is unrealistically high since I happen to know a real bioinformatician or 3, but I saw a CV recently that was ROFLMAO (I genuinely don't know what that stands for) level inflated. It turns out that sometimes people using web based Shiny apps might think that since they can successfully load data into webpages that they are now experts in R based bioinformatics. Why not? There are definitely people out there successfully selling themselves as proteomics experts that have dropped off samples at cores or have loaded sample queues in instruments maintained by real experts.
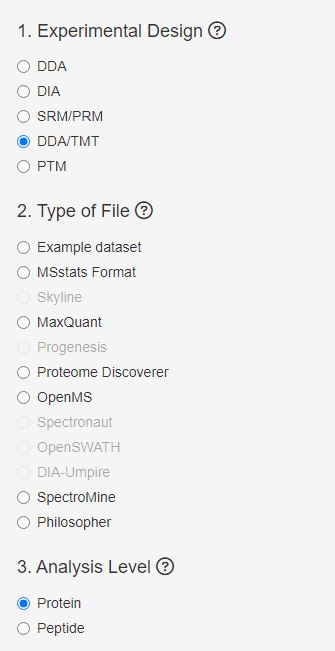
With all these great new web based tools you can keep the ruse going if you want and MSStatsShiny will certainly help! This tool has been live for a long time now (it feels like years and years) but now the paper is out.
MSStats is something I've honestly never used except through the ShinyApp and I know that it is often considered the gold standard.
The first thing I checked when I saw the paper was out was for DIA-NN compatibility, and it doesn't appear to be ready for that yet, but there is a ton that is IS ready for.
Including Proteome Discovererererererer!
Look, I know that no one likes Discoverererer as much as I do, but as I'm training a bunch of new people this year, I keep showing them it because nothing gets us to the PSM level visualization as fast.
Off topic, but if you were wondering what the upper limit is for PD, I can say for sure now that it can easily handle more than 2,000 single cell proteomes (250-ish SCoPE-MS runs not counting blanks/controls, etc.,). AND if you randomize your TMT channels and your injections for two closely related cell lines derived from the same type of cancer (different patients and immortalization methods) once you get north of 50 injections -- THEY CAN FIND EACH OTHER BY PCA ALONE. That might sound like not a big deal, but try that with 200 scSeq files from 2 different cell lines. PCA? Not a chance. You need real dimensionally reduction for that and cell cycle clustering and probably some level of stream-type trajectory analysis magic to find your cell type friends. I'm not sure PCA will even make sense of n<1000 per condition for scSeq. Proteomics data? BOOM. AND it gets better as you keep going (the divergent clusters are part of my experiment, don't stress it). The biggest question for me was whether I was going to break PD with 500 SCoPE-MS files. Half-way through it ain't even really struggling, so I like my chances.
(If you are stupid enough to try processing 4,000 single cell proteomes in a desktop interface I strongly encourage you to turn off "Found in Samples" and "Abundances" in your PSM and Peptide Group level reports. I still strongly recommend leaving the Data Distributions post-processing node in. It is just too useful, but hide the results when looking at your full reports because it wills struggle with a matrics with 4,000 proteins X 4,000 conditions. (Imagine what that is at the PSM level. Even though it isn't maxing out my RAM something is limiting the speed at which I can sort through the data).
Pretty sure I need to run MSStatsShiny locally for this analysis, but I might try the web interface anyway.


Hello. Following your post, what ate the best options (statistically) to analyse the proteomics data? Moreover, In your opinion, what are the current softwares with better performance for protein identification (e.g. PD, MaxQuant)? Thank you
ReplyDelete