Sunday, April 30, 2017

A new method for characterizing HCPs in antibodies!


This one took me a few minutes to figure out -- especially with the Celtics down and my attention divided. With the C's up 11 points, I was able to figure it out finally!

HCPs are residual host cell proteins and they are problematic for antibody production. When people manufacture antibodies (using that word to distinguish from our own native antibodies), they are made in host cells. Before that antibody can be used to treat people it has to be heavily and perfectly characterized. The HCPs are proteins that might tag along and we need to know what they are as well -- and be able to prove that they are safely gone and no risk to patients.

Sounds tough, right?  It was, but this new paper ASAP at ACS shows you exactly how to pull it off!


How'd they do it? They take advantage of the fact that mABs are trypsin resistant in their native state (did you know that? I didn't!) and the stuff they can digest ends up mostly being HCPs. Shotgun proteomics on a QE Plus and downstream analysis with informed knowledge of their host cell  allows them to develop a rapid and sensitive new assay suitable for a production environment!

Saturday, April 29, 2017

Create multi-consensus reports in PD 2.1 from different studies!


Yesterday I was visiting some of my favorite labs and got a great question from a great scientist!  If you are in one study in Proteome Discoverer, it is very easy to combine previously processed datasets. You just highlight the ones you want and Reprocess. If 2 files are selected, the ability shown above to "Use Results to Create New (Multi) Consensus" reports appear.

The question was: How do you combine results from different studies. When I was actually in the lab, I made this too complicated. I just discovered it is very easy.

Just add the .MSF files you want to combine into the same study.


Add the .MSF file the same way you would add a new .RAW file and PD adds it right into the Analysis Results tab. Then you can make a multiconsensus report.

I accidentally tested files from different hard drives. Totally works! Though, it didn't finish the consensus until I was almost done typing this, so it might have taken longer than normal...it is too nice outside to investigate!

Friday, April 28, 2017

The current state of proteogenomics!!


Do you think our field is moving fast? You're right!  It is. At rocket pace. The sample prep is better, the chromatography and the instruments are obviously better, and the software is catching up.

Proteogenomics, however, might even be developing at a faster rate because it is so new -- and there are so many great genomics and transcriptomics tools that we can be borrowed and used in conjunction with our technologies.

I've been trying to keep up -- and it is really tough.

This stellar new mini-review in press at MCP will catch us all right up to the cutting edge! 


It breaks the field down into the current key components -- describes what has been done so far -- and then tells you where to get the best and newest tools.

Even if you don't read this in it's entirety you should download it. Next time you're sitting in a talk and someone is rattling through proteogenomics (heck, or just transcriptomics!) jargon you can "Ctrl +F" on this PDF and find a description of what that term is -- and what application of it can do for you!   There are a lot of terms in here that I've heard and seen dropped and it is great to have a current reference that is applied in respect to proteomics!

Thursday, April 27, 2017

Can we improve clinical histology assays with PRM?


While frantically looking for material for yesterday's post (that is published and I can talk about it!) I found something new and super interesting on a similar topic!  It is in press at MCP here!


This group grabs a bunch of FFPE tumor samples and evaluates whether they can use PRM on a Q Exactive to make the same diagnoses that the clinically approved assay (Immunohistochemistry by trained pathologist) can on the same sample.

This falls right into the topic of an ongoing conversation between some experts on Twitter this week. After I described some of the rigorous QC/QA protocols in the JHH Clinic -- there were a few responses similar to this one from Dr. Eyers...


...who is of course right!  Pathology assays, especially histology ones are still done by trained pathologists looking at one sample at a time through a microscope and grading protein changes by colorimetric shifts (by eye).  These are extensively trained medical technologists with ASCP certifications, and more commonly by MDs who specialized for years in these areas. These manual assays are great -- but they are slow -- expensive -- and yeah...rigorous QC/QA is tough. Stay tuned -- everyone is working on these things -- this paper from Vanderbilt is proof!!

It is about tumors and the tests that find out what drugs someone is being treated with. This excerpt is a great summary:


The two immunotherapeutics mentioned will target tumors that are PD-L1 positive -- but the approved IHC assays (important to note there are more than one) have been reported to be problematic, possibly because of false positives and false negatives. [Important note: they are tumors, there could be other mutations that cause the drugs not to work, of course, and this paper explores several of those!] But if we can create an assay that is as good as the IHC assay, but faster or cheaper -- this is a win for the medical system and patients. If we can create one that is better -- either or, especially, as well -- then this is a no-brainer!!  Heck, even if we can just establish a complementary assay that will improve on the numbers mentioned above -- this is could have an immediate and measurable impact on patients!

This is what Vanderbilt sets out to do here. They go specifically after PD-L1 (and related protein) peptides. They create heavy peptide standards for the markers they are interested in. And they build PRM assays.

How's it go?

(Chris Pratt is still funny, right? First GIF that popped up when I typed "AWESOME")


1) They did the IHC method as well. This is important. They appear to have found some false positive with the staining. I'm not equipped mentally to evaluate that part. But I'm glad they have this as a comparison
2) The PRM specifically focused on the IHC assay -- match very well
3) The mass spec method (which is interesting, it is basically a low-high instrument method on the QE) finds some important information that is not available in the normal assay.
3.5) Wow. That GIF is annoying a few hundred times through it. Hopefully as a reader you don't have to see it as many times as I do while writing it...

Elaborate on 3 -- The IHC assay is good for determining if PD-L1 is on the surface or not. It is not, however, very good quantifying how much is there. The intensity of the staining signal does not match up with the absolute quantification.

Also -- there are other proteins here at the surface that are closely related and can interfere with the IHC assay -- or -- the immunotherapeutics. They look at this more closely and find PD-1 and PD-L2 that can easily be assayed by PRM, but not with the IHC assay.

They go further here and look at the effect that glycoslylation of these proteins plays. If you're trying to bind these proteins with an antibody for diagnosis or treatment glycoslylation may mess this up. And -- there are a bunch of varied glycoforms...

Conclusion: The IHC assay is here and valuable and clinically certified and has helped a ton of people -- but mass spectrometry, right now, has the ability to add extra information to these diagnoses and complement the IHC assay.

Important point: The LC-MS described here is 2D separation and 60 minute gradients on fractions. This isn't an experiment that is ready for the clinic. This is an exploratory assay. But...the promise is definitely here for an LC-MS assay to fill in the gaps and make an impact on patients! This paper is an awesome hint of what the future could hold!


Wednesday, April 26, 2017

Screening protein isoforms predictive for cancer with Immuno-PRM!


I saw some of my favorite talks ever today. Seriously, proteomics is going in some amazing directions. As I'm scouring through the literature to determine what I saw that has and hasn't been published from yesterday's great speakers -- I realize I've got a lot of stuff I can't talk about quite yet, but that's okay! Plenty of stuff I can!

Check this out (it's from 2015!)


It is no secret that they are translating some amazing proteomics directly into the clinic in Luxembourg. Yeoun Jin Kim contributed to an awful lot of this work and is just getting set up here in Maryland and bringing these (and new!) techniques to our community.

In this study, the Domon lab demonstrates the application of fast capture immunoaffinity with ultrafast gradients and parallel reaction monitoring. Check out those RAS peaks at the top of the page!

They use a technology called MSIA that you can read more about here --


--essentially, an automated system rapidly enriches for the protein(s) of interest.

Personally, I'd like to think that I can detect anything in a 1D separation -- but if you are under pressure to do a very rapid assay from a machine time perspective, these authors argue that rapid automated enrichment coupled with rapid LC is the way to go.

They use heavy labeled peptide standards for the main cancer driver mutations -- optimize for them in cell lines that express them -- but then show that they can find them in 4uL of plasma from real patients.

Classically, we think of QQQ and MRM in the clinics -- but they are looking for single peptide (amino acid, in some cases) changes. There aren't multiple peptides that you can use -- heck, there aren't multiple transitions you can use at unit resolution for all of these. PRM to the rescue!!

Tuesday, April 25, 2017

UVPD for top down proteomics!


What great timing!  This issue of JPR just dropped and this lovely image is gracing the front page! It is from this new paper.


I'm tempted to not read it at all -- cause tomorrow Tim Cleland is going present this data here at the NIH!!


For those of you in Maryland/DC/VA area -- this is a reminder to register for this awesome event tomorrow!!  (And please do register...the NIH has some very serious rules regarding how much coffee (and lunch) we can have delivered per participant. Looks like we've got about 50 people on the list -- and if 80-100 people show up for this awesome day of cutting edge science and we run out of coffee...well, some of you know what happened last time....


For those of you that can't make it -- I highly recommend the paper!

Highlights:

HeLa top down fractions (from GelFree system ~ 5-45kDa)
Ran on Orbitrap Fusion Lumos with an equipped UVPD
GOAT was used for gradient optimization (yeah! this needs to be used more!)
UVPD and HCD were highly complementary in terms of proteoform identification
UVPD was (no surprise) superior for PTM localization (democratic fragmentation, FTW!)
Umm...data was processed at this thing -- that requires investigation, but I've gotta get going. It looks like a super computer that is running Prosight!

Monday, April 24, 2017

It's IonStar time!


IonStar has shown up on this blog a couple of times before after it was revealed at ASMS 2016. Full disclaimer -- my friend Jun Qu and his team at the University of Buffalo developed this methodology and I have helped with some of the data processing and algorithm comparisons, so this post is probably even more biased than my typical ones.

I'm writing about it now because the paper fully describing the method was just accepted at JPR, you can find the ASAP copy here.


What is it? It is a universal clinical proteomics workflow that is focused on these 2 things in this specific order:
1) Absolute reproducibility
2) Greatest possible sample depth available without compromising #1

I worked in a clinical chem lab for almost 6 years. In those environments there is one central rule -- you can not be wrong. Patient lives depend on you being correct.  Our instruments were thoroughly and completely QC'ed every 4 hours, 24 hours a day. If a QC metric was out by 2 standard deviations, you could run a blank, rerun the QC and if it failed again -- an alert was placed into the system for every sample ran since the last QC. The doctors were warned to not trust the results or the results were pulled entirely. We were then allowed to recalibrate the systems while someone pulled all the samples for the last 4 hours from the refrigerator. Then we randomly pulled 1/10 of the samples and tested them. If they were not spot on, we stopped everything, and reran every sample of the last 4 hours and started checking the ones from before the previous QC (in case the instrument passing was a fluke). All this time a backlog piles up and you get to start planning for your overtime. I still sometimes have nightmares about these late nights trying to get caught up.

We all know proteomics is moving toward the clinic, but it is never going to get there until it has quality control and assurance metrics and is highly reproducible. IonStar is a great shot at this and it is composed of the following components:

1) A universal protein extraction/digestion methodology
2) A high capacity peptide trapping (4ug of peptides are trapped on a relatively large column) and elution nanoLC method (they employ a custom designed commercially available 100cm(!) nanoLC column that is maintained at a relatively high temperature for reducing back pressure and keeping chromatography perfect
3) A universal mass spectrometry method on (in this case) and Orbitrap Fusion (high resolution MS1 and MS/MS). This paper describes the optimization of this methodology
4) A data processing method that requires robust retention time alignment and extremely strict requirements for peptide/protein result reporting. Peptide retention time is even considered in terms of FDR calculations.

You'll find all sorts of boring details in this paper regarding the years of work this group put into perfectly optimizing this methodology with heavy peptides and a complex mixture of complete proteomes mixed together in different amounts. This was tons of work. Now that they have a universal technique, however, it is time to apply it.

Q: Could they possibly get a few more peptides if they tweaked this parameter for this study or changed this cutoff for this different sample?
A: Yes.

But the goal here is to have a set of (huge) files where they can compare a sample ran 2 years ago to a sample ran today -- and the peptide RTs line up. And...now that they don't have anything to tweak or optimize in the sample prep or instrument parameters -- they can just run and get to the biology! With the exception of the fragmentation energy optimization paper below, this is what they've knocked out so far...though and they haven't updated this in a bit, I can think of at least 2 that I've seen that aren't on this list.


Worth noting -- there is robust QC employed in this lab with heavy peptide standards spiked into complex matrices. Also, due to the extremely high peptide RT reproducibility, peptide inference is in play here. As the cohort of samples increases -- so do the number of confident peptide IDs!

Saturday, April 22, 2017

Can we do some proteomics with a Raspberry Pi?


Do you know what people are never asking me?

"Hey Ben, how do I process proteomics data if I only have 3.5V of electricity and $25?"

My answer? You need a Raspberry Pi.

First of all -- I need to place credit where credit is due -- this is not an original idea. I first saw something like this at a place I visited that I'm pretty sure I can't say that I went to -- or what I saw there or what they were doing. So...I'm extremely unsure how to credit this, but this wasn't originally my idea -- thank you Dr. S.?


Second -- I need to credit the ladies in my life -- my 10 year-old niece for inspiring this project and Dr. Norris for getting it going "hey, lets all learn Python on Xmas break so Rhianna can rewrite and skip all the boring parts of her favorite video game!" (In action, above)

Third of all -- y'all do know about these little things, right?


This is a Raspberry Pi #3. Since my weird orangutan hands aren't good for scale, use the HDMI plug for your frame of reference. It is tiny (and there are smaller ones now! we're building some super cool little things around the house with ones that aren't much bigger than thumb drives!). It is essentially just a tiny PC motherboard with an HDMI output, a power supply, WiFi, Ethernet and 4 USB ports -- and that is about it. These things cost like $35, though one of ours we got for Black Friday all set up for $15 (though it didn't get a cool transparent case shown above ~$15)

Now -- I really had no idea what to expect coming out of this project. The Pi3 has a quadcore processor, but so do most modern cell phones!

What do you need?
A memory card (we got the maximum 32GB microSD that this board supports -- pushing this project to a whopping $65...which made me feel dumb, till I realized that's not unusually high for a video game these days!)
An operating system (I'm using Raspbian at first -- cause it looks JUST like Windows, LOL! Incidentally, the operating system comes with a bunch of video games --including Tetris! Win!)
Python (comes with Raspbian already installed -- plus things that teach you the language! But it is Python 2.0 and 3.0...complications remain to be seen!)

Okay -- so this thing runs Python and there are tons of Python tools that are out there in the world. Part of this exercise has been for Ben to finally (maybe) be able to evaluate some of them there Python tooly thingamajings. If I'm curious, I will honestly load up and check your R package (this is, however, very rare). If pressed because you did something super awesome -- yes, I will load up command line. But until now, I'll just have to take your word for it that you wrote some awesome Python code (or...honestly...not write about it...)

But there are awesome tools!  Like:
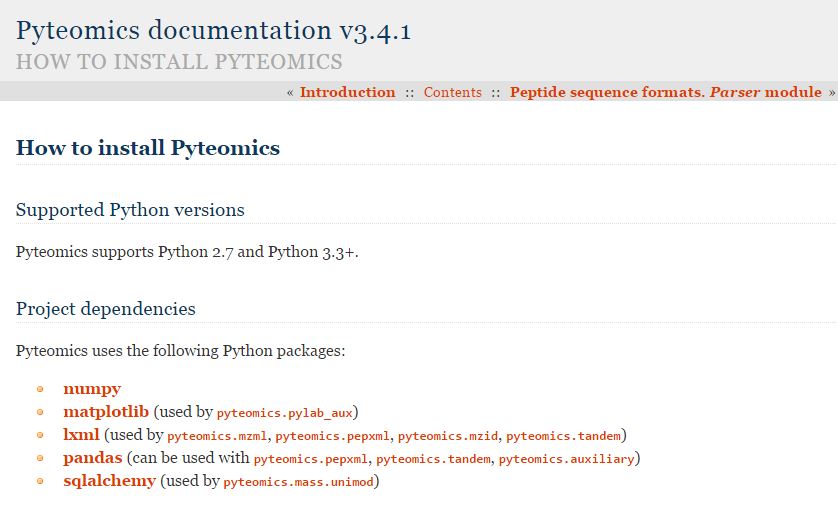
Pyteomics!


Looks great, and there are people doing stuff like this all the time. It remains to be seen whether I can run this on my handheld box. Maybe I'll get there.

But -- get this -- there are premade proteomics tools for Raspberry Pi already out there!  The idea for this post isn't original in any way at all!  Even better!


(These need to be screenshots from my Windows PC, I'm not energetic enough to do this from the Pi and email them...)

There are HUNDREDS (maybe thousands!) of awesome scientific tools already developed to run on these little boxes. Check this list. I know I was amazed. Everything from DNA sequence alignment to imaging software to -- you guessed it, mass spectrometry data processing!

The first thing that pops up for ctrl+F "proteomics" is Mmass!  It appears to have all the same functions on this little box as it does on Windows.

But -- check this out -- those forward thinkers at the GPM made an X!Tandem Raspberry Pi package!


Okay -- so I found a search engine (even better, one that I'm familiar with!) and -- well, this is a long term rainy day project (that has been somewhat hampered by the fact the Pi has to be really close to it's WiFi source for me to download stuff) -- so more on this topic later -- eventually...probably...my motivation isn't quite where it was when I started writing this, but I still feel like hitting the "Publish" button.  I had no idea this was such a legit scientific tool that would be so easily accessible for a non-programmer!  

Friday, April 21, 2017

CryoEM + Native MS + Crosslinking = complete protein complex pictures!

I just sat through a great talk on Cryo-EM. Which is interesting because a lot of them are showing up in Maryland. If you haven't seen these things, I suggest you look some stuff up on them. You  can visualize intact proteins and tell - from the image - how many subunits you have and stuff!

One of the papers mentioned in the talk was this new one done in conjunction with the Heck lab!


Why is it on this blog? Cause Cryo only fills in the part of the picture (and you have to have a really big protein or you can't see it)

This is really cool because we're almost completely complementary technologies. CryoEM gives you an image of the structure -- native mass spec can give you the mass of the structure. Breaking  the noncovalent interactions of the individual protein groups can get you subunit exact masses for MS1 (or, better yet, top down!).  (Oh..and if the protein complex is so big it is hard to get native MS, chances are you just LOOK AT IT WITH A MICROSCOPE!!)

This study goes one step further, but you don't really see much about it till you get pretty deep in the supplemental info. They chemically crosslink and digest the whole thing for LC-MS/MS shotgun and BOOM! probably way more (j/k!) than you wanted to know about this protein complex!  In this case they reveal the internal workings of how some incredibly simple organisms maintain their circadian rhythm.

Thursday, April 20, 2017

Yocto-molar sensitivity and 7 orders of magnitude dynamic range -- in an Orbitrap!!

Okay...if you've visited this blog much at all you've heard my soapbox proclamations that if you need ultimate sensitivity you need to use the Orbitrap. I'm very biased. But...maybe this new paper might convince you that --for absolute sensitivity you don't go to the triple quad -- you go to the Orbitrap!


Let's start out with this clip taken from WikiPedia, just so we see how amazing what we're going to see in this study is.


You could argue a yoctomol of a substance isn't very much of that substance. In fact, WikiPedia doesn't currently have a lower prefix listed. In fact, the world gave us...


DJ Jazzy Jeff getting thrown out a door by Uncle Phil for over a year(!) before the yocto- metric prefix was even coined!

This is a really small amount of material AND these guys would like you to know that you can measure this amount of material with this generation's Orbitraps!


The paper hasn't been published yet, but it is a solid piece of work on exploring the ultimate sensitivity that you can get with mass spectrometry.


They mess with a lot of features, but to get sensitivity levels I've never heard of -- they do 2D nanofractionation and PRM. Interestingly, they achieve such levels here that they don't find that increasing their maximum injection time increase their sensitivity. This might be a more powerful feature in a more complex mixture (but that is just speculation on my part!). 


Random mass spec nerd note from the paper (that is really smart!):

They drop their nanospray voltage throughout their reversed phase gradient (less voltage as acetonitrile goes up!) 


The only way I can think of setting up that would be time consuming, but it makes a lot of sense in terms of spray stability!


Wednesday, April 19, 2017

TCUP -- HRAM-MS + Free code = bacterial identifications!!


I'll be clear -- this isn't the logo for the new free TCUP methodology/software that I'm very excited about this morning!  This is an unrelated product that I'm very excited about.


This is TCUP and this paper hasn't been edited for print yet, but it is still very much worth looking at. You can find the early release here! (Sorry, traveling and bent my laptop a little. Can't figure out how to right click and insert link...) EDIT: Got it!!


We've seen stuff like this before over the years, right?  I mean, the great Catherine Fenselau wrote a paper called "identifying bacteria with mass spectrometry" in 1975!  What makes this one special?

1) High res accurate mass fragment ions (QE Classic!)
2) A really smart discriminatory (open...but Python...) data processing pipeline that can take genomic information that we know for sure (perfectly curated peptide/protein sequences) and even stuff we don't know -- by using BLAT or BLAST (think of BLAT as a better BLAST that only works for people who aren't using Windows)

Here is the goal -- most clinical microbiology labs are still doing stuff the way Louis Pasteur and his students were doing it -- isolate a colony, multiple that colony, see if that colony will grow on this agar plate without glucose or on this agar plate with blood -- and on and on.  There are big downsides here:

1) Microbiology labs are super gross. Ever walked into or by a clinical microbiology lab? I had a friend who worked in one when I was in clinical chem. I stopped having lunch with him 'cause if I had to go in there I wouldn't actually want lunch anymore. Gross. But more importantly....

2) Traditional microbiology approaches are SUPER SLOW. You have to wait for a bacteria to grow, isolate, grow isolate, and not everything is Clostridium perfringens (doubles in like 20 minutes without oxygen and insanely stinky!) some of this stuff doesn't make one cell division in A DAY!

Okay -- and I know there is a bunch of MALD-TOF based microbial identification tools out there (that are awesome for the microbiologists! and, p.s., almost completely pioneered at JHU/JHH) but they have limits. They still require pure cultures are isolated. They require matching libraries for the organisms, and so on.

What is awesome about this technique?

1) Mixed cultures?  -- no problem (no colony isolations!!) HRAM MS/MS don't care!
2) Deep confident characterization of the organisms in those cultures?  Yeah!
3) Can handle the fact that bacteria mutate like CRAZY? Yes! Integration of BLAT/BLAST allows for sequence variation.

We're gonna see lots of this going forward -- but this nice free software package might save the people out there working on this a lot time!

Monday, April 17, 2017

Analysis of variability in label free quan measurements


I'm going to put this here, even though I'm not 100% sure I get it all.


Maybe I'll figure it out while I'm typing this!

The authors set out to understand where quantitative variability occurs in different global label free quantification methods. To get going they start out with something really hard to do proteomics on -- plant matter, specifically my old enemy Arabidopsis thaliana. They follow a standardized protocol to extract the proteins/peptides from the plant (which involves lots of liquid N2 and manual crushing...) and do proteomics on it.

Edit:  (cause I want there to be something that shows up in Google Images if you type "scumbag arabidopsis" from now on.)

They use a big EasySpray column and use an Orbitrap Velos Pro running "high/low". The data processing is done with Proteome Discoverer 1.4/Scaffold, Progenesis IQ and MaxQuant LFQ. To get a feel for variability they focus on about a dozen specific proteins.

What is interesting:

They find the 3 software packages get different results -- which makes sense to some degree, they are all doing their calculations very differently. And you are in a super complex matrix and focusing on a small number of targets.

A lot of the variability they see is between the point they extract the proteins and the point the data report comes out. I honestly started reading this because I thought this would be an analysis of the differences between harvesting/digestion techniques, but one technique is used here. One really complex technique.

But...a measurable amount of variability appears to simply come from the individual variability of these clonal plants...which should have the same genetic makeup....  Makes sense to me -- I always like these images @PastelBio uses for illustration...


What I don't get (and this isn't a criticism at all, this is probably me just not being smart enough to get it!):  I don't fully understand how they separated upstream technical variation out of the equation to get to the individual biological contributions from the clonal plants. Still an interesting paper, and something that might be consuming some of the idle process time in my brain today.

Sunday, April 16, 2017

Histone post translational modifications play a central role in P.falciparum development!!!


WOOOHOOOO!!!!!  I am having the best weekend. Great weather, awesome people visiting -- then my Google Scholar Alert directs me to a beautiful study revealing a major missing piece of the P. falciparum regulation puzzle.

Warning -- this is probably gonna get all rambly. I am too excited for it not to be!

P. falciparum is responsible for the most deadly form of malaria we currently have for humans (did you know we know of at least 200 vectors that cause malaria (cool podcast about it), but only 5 normally get us -- and throughout our evolution we've had to beat a few -- mostly cause a vector drove us almost to complete extinction a couple times? [Another plug for the Fever])

Laurence Florens et al., first gave the world a deep comprehensive proteomic view of 4 stages of the parasite 15 years ago and loads of awesome work has been done since -- but something always seems to be missing. No way can this dumb little protozoa be doing all this stuff -- look at that picture above -- 7 stages of life cycle -- hijacks the cells of two different species (it has different development stages in the mosquito AND in us -- occupying our livers and red blood cells) and does all this regulation with 5,369 genes. Something critical is missing in our understanding here.

500 HISTONE MODIFICATIONS would sure explain a lot of it!!!

And that is what these authors have found in this stellar study. They enriched histones out of the 7 parasite stages, digested them (I've never directly worked with histones -- the enrichment and derivatization for LC-MS is kinda fascinating -- detailed really well in the paper) and single shot LC-MS into an Orbitrap Velos Pro running a well-optimized "high/low" mode.  I seriously try not to look at the author names before I read a paper, but I sometimes get into the methods section and think "wow, they know what they're doing" [my rule is to never tell you about the other ones] --and sneak a peak -- yeah...this is one of those.

Did I warn you this was going to get rambly? (I LOVE THIS PAPER!) It might get worse.

The authors get their peptide spectral matches in Proteome Discoverer 1.4 via Mascot using a large series of preset post-translational modifications that I have to imagine are well-characterized for histones. Worth noting -- this is not the first P.falciparum histone study, they have info to guide them a little here, but there is obviously a deep knowledge of histone modifications in play to search these RAW files without apparent deltaM searching.

The data next goes into EpiProfile.


I was impressed when this paper first came out but since it didn't really affect me I never even contacted the Garcia lab to get access to it (which you can here).

From a purely "what are the current limitations of proteomics" standpoint -- EpiProfile is important. Oh -- and it is going to be a big topic this summer (did I mention I love this paper?). This is why:

Imagine you are doing XIC based label free quan on sample 1 and sample 2. In sample 1 you find peptide HAPPYK with an intensity of 1e6 that elutes at 23.4 minutes. In sample B, you only find HAPPYK at that retention time at almost baseline, but at 10.8 minutes you find HAPPphospho-YK with an intesity of 8e5. Unless you've got some awesome tools that I don't have for global analysis of this type, get ready to buckle down for a fun filled afternoon of manually linking your modified and unmodified variants in that Excel sheet!  (PD 2.0/2.1 can make the job a little easier for you -- see video 22 here, but you still have to do a lot of manual work)

EpiProfile does this automatically for histones -- and the way it does it sounds so elegantly simple that I'd argue the logic behind it stands as an important development for our field all on it's own. (Worth noting? BioPharma finder does a great job of this as well -- but last time I tried it, I couldn't realistically feed it more than 5 protein sequences. The author designed it with exactly one protein in mind).

Back to the new paper! What did they find? Nearly 500 histone PTMs in P.falciparum -- over 100 that pass stringent manual validation. 15 new histone PTMs that (so far) appear exclusive to the parasite. (Not to sound hopelessly optimistic, but anything the parasite has that we don't sounds like a potential druggable target to me!)

Perhaps most importantly -- specific histone modifications that correlate with life cycle changes in the parasite, answering important questions -- "how did it just do that?!? the transcriptome doesn't appear to change at all!!"

One more note and I'll go do something else -- this isn't it from this team on this project. 2 other publications are en route. I know I'll be looking out for them.

Saturday, April 15, 2017

Hybrid search -- is the last limitation of spectral library searches gone now?!?!


Ummm...okay...so, I've kinda been uncharitable toward spectral libraries in proteomics in the past. Yes, they are rocket fast. Yes, they have great intrinsic matches and low false discovery rates, but I'm generally not looking for stuff that has already been identified. I'm looking for new stuff, and you can't do that with spectral libraries --- til now!!


What's it do? It takes aim at exactly what I just talked about. Imagine you upload a huge set of spectral libraries from NIST and it has all the unmodified peptides anyone has found so far for your organism.

You search this with MSPepSearch versus your newly acquired spectra. In the past, if you've got an acetylated peptide you fragmented, it won't match anything and the engine goes right on by.

Hybrid Search will go to that spectra and look at everything it has in the spectral library. If your experimental spectra matches something in the library -- if you shift a couple fragment ions and the precursor mass by exactly an acetylation -- BOOM!  Match.

If you write it out like that it sounds really simple. I'm sure it wasn't or someone would have done it a while back -- but it's done now and integrated into the free for everybody MSPepSearch.

EDIT: 4/16/17 -- I got a little ahead of myself. I downloaded MSPepSearch this morning from NIST, and the HybridSearch function doesn't appear to have gone live for external users yet. I didn't realize the paper was JPR ASAP (published online ahead of print date). I'd expect to see the new version rolled out soon (but probably not before the paper is actually published!)


Friday, April 14, 2017

What does "auto" dynamic exclusion mean on a QE?!?!


Let's go on a little journey, that starts out odd but then gets awesome.  It begins with a Q Exactive HF that was getting awesome peptide IDs -- then all the sudden wasn't.

As I was reviewing the data and method files I came across something I have never seen before (on anything except the awesome and ridiculously easy to use QE Focus) -- automatic dynamic exclusion!

Well -- my Tune version didn't have this. So I had to go to the FlexNet portal and get it.

I downloaded the 3GB .ISO file and -- ugh -- out of blank DVDs.

Ordered some -- arrive Monday -- but I'll probably forget about this

(Told you this was a journey).

Asked DuckDuckGo "how to use an .ISO without a DVD for free (cause I'm cheap)"

It suggested WinISO and DAEMON toolkit. Tried both, but they require that you install Yahoo to use them. Despite recent interest in the QTrap in my neighborhood, it is not 1998, so I politely aborted software installation.

Asked Reddit how to do it and it led me to this thing -- no ads and super easy to use. It makes a folder wherever you want that Windows thinks is a DVD drive. (Blog author not responsible for damages and not endorsing this, but I'm totally using this from now on.)


Now that I have the ISO on my drive, I can run the Setup.EXE, add the QE HF to my instrument configuration and BOOM!


I now have the ability to use Automatic dynamic exclusion on my QE HF! Yeah! What the heck does it do?

If you pull down the Release Notes from the folder -- there are no clues at all -- but there is something SUPER COOL!  (More in a second)

But the help manual tells you what it is doing:


Auto means that it takes your chromatographic peak width -- multiplies it by 2.5 and that is the number it uses.  Does that mean it is measuring your peak and peak shape? Nope!  It is making use of a function you have probably been ignoring. (See #1 in the figure with the monkey above!)

Previously this function did 1 thing -- determine how often the QE should do its rapid little AGC prediction stuff. For most normal nanoLC separations the QE would sample pretty accurately by default, but if you are doing serious UHPLC or weird separations like capillary electrophoresis with super narrow peak widths you could undersample and be in danger of space charging or other things.

Now this can integrate into the dynamic exclusion (DE). If you use auto, you need to really look at your peaks and get a feel for your peak widths to use it right:

(borrowed from OriginLab.com)

It isn't this complicated. Go into your RAW data, find at least 2 good peptides, one early and one late in your gradient (better yet, several) and use the ranges function to draw the peak XIC outline with a tight mass tolerance (from the MS1) something like this:


Once you have 2 peaks you can take your cursor and run it along the middle of the peak (1/2 way between top and baseline) and get a good measurement (there is a little time counter in the bottom right corner!). For normal nLC you're going to get something like 10-15 seconds probably. I had an nzCE separation file open and mine, above is 2.5-5 seconds. If your peaks are that different from beginning to end, measure a few more. Turns out that 5 second one is weird, mine are pretty much 2-3 seconds. For AGC sampling purposes err toward the smaller ones -- but note, this might lead to more repeated fragmentations of the wider peaks if using "auto". Actually, if there is a big difference in your peak shape from beginning to end of your gradient, you might want to try tuning your gradient. (GOAT is a good option!)

Mystery solved. We all now know what that feature does and how to Tune it. (P.S., this was what was hurting the peptide IDs in the QE. Peak width was off. Adjusted = fixed!)

Let's get to the AWESOME PART of this new software!