My life would be so much less interesting without Google and DuckDuckGo Image search...
Disclaimers!
1) I can't exactly agree with the image above. It is there because it is funny!
Many people, including internal scientists at my day job will take the official stance that it is much much better to compare reporter ion experiments if you have a channel that is a shared standardized control -- either a pooled sample or some sort of nice sample you can use to measure variation. Honestly, I'm with them. If you can possibly do it -- and you think you'll ever want to compare this TMT experiment to another one -- bite the bullet and put in something as a control you can use -- if not a pool, a commercially available standard of similar complexity. If human, a commercially available HeLa lysate will be a great option!
2) This may not work for you. I downloaded 60GB of expertly ran data from our friends at CPTAC and what I'm going to describe below appears to have worked. I can make no guarantees on the quality of this.
3) This took a long time to do. Not in a Ben constantly working on it kind of way, but in a computational sense. Each iteration of the full data processing took about 10 hours (I made a mistake or two) and each reprocessing the multiconsensus was 2-5 hours. What I'm trying to say is that this could be improved upon, but I hope it gives you a good place to start!
What's the problem here anyway?
Sometimes you just can't don't have a control channel. Two of my friends this year have ran into this problem. In one case she found something really cool in some TMT experiments this month that she hadn't seen since a completely separate set of patient samples back in 2014. There has to be some way to compare, right? Another wants to compare his results to results another group published.
Experimental sample set:
I downloaded two sets of samples from this awesome study. I chose this for 2 reasons: 1) They used iTRAQ 4-plex. This keeps my workload lower. 2) They had a shared control channel in every experiment. Would I have used these if I'd realized up-front I was looking at 30GB/sample and my PC would be working all weekend processing and reprocessing 60GB of RAW data? Probably....
Worth noting: Check out how great the CPTAC Aspera download manager is. It pulled down one file at a time and check out how well the 48 files are organized!
It created a folder on my desktop with the name of the paper I took the data from. It then put each separate experimental file into it's own folder within it.
Experiment 1: Run the 2 sample sets with no normalization.
Goal 1: Get RAW quan values to look at
Goal 2: Find proteins that do not change between the 2 sample sets that we can use to normalize with
Hopefully with 60GB of RAW data I only have to do one processing workflow! It took 10 hours!!
This is PD 2.2 Beta, but there is nothing magical here. Every feature I'm going to use is in PD 2.1, I just accidentally broke my copy of PD 2.1 and 2.2 is so good, I haven't tried fixing it.
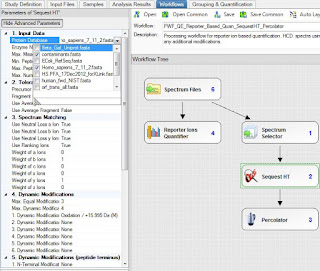
Sequest and Percolator. Static mods of iTRAQ 4plex on K and N-terminus. 10 ppm MS1 tolerance, 0.02 Da MS/MS tolerance. Static iodoacetamide. 20ppm mass integration of the reporter ions. (Higher than I like, but it was the default and I'm not spending another 10 hours of processing time!) Searched an old uniprot/swissprot FASTA parsed on "sapiens" and the cRAP database.
I ended up with about 11,500 unique protein groups and amazing quantification efficiency (this data is AWESOME, btw!)
This protein is perfect! I found it by filtering this way
I want a protein that has tons of PSMs -- isn't a contaminant -- and isn't interesting in any way from a quantitative sense. 126 PSMs and they're all 1:1
Okay -- but look at the raw abundances. All 4 samples in the F1 set are 4,800 and the F2 set are in the 13.5k range. (Let's not think about units. I'm using this one so I don't have to think about scientific notation and risk losing zeros).
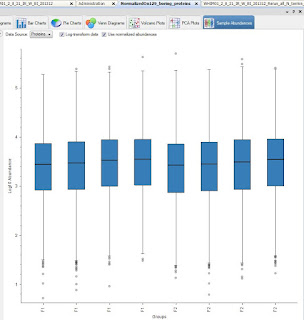
Also -- I lied, I am going to show you something that PD 2.2 has. This is the sample loading plot:
For whatever reason, it appears that the F2 set has more peptide than the F1 set.
If my method of normalizing works, we're going to assume that an improvement in these ratios and the loading will be a result.
I can try normalizing with the one most boring protein, but it would be better to have more PSMs to normalize with if possible.
If I expand my filter above to call any protein with a ratio across all samples Boring if it is between 0.8 and 1.25 in EVERY ratio. This gives me 129 boring proteins. What I want to do next is create a database of these that I will use for normalization.
Highlight the list, right click (or whatever you do if you are running this on a Mac) and "Check all Selected")
Then...File --> Export --> to FASTA!
When it pops up -- tell it to export the highlighted proteins only.
Now you have a FASTA of your most boring proteins. The more you have, the better! The goal here is to find things that might be in similar copy numbers in your cells. In most cases I think it might be less tricky than this example. Cancer cells are all messed up. Even things like cytoskeletal proteins aren't constant. By looking for things in your actual data that aren't changing -- maybe this'll be better!
Now add this new FASTA the way you normally would. (Administration/maintain FASTA files/add)
Experiment 2: Finally(!), go into your previously processed results and Reprocess the last consensus test of your data.
Go into your peptide/protein quantification node and set it up like this: (Yours will look a little different for now. but the boxes are the same.)
Normalize on Specific proteins. Choose your new FASTA file and scale on your controls! Reprocess the consensus!
And...if yours worked the way mine did, check out the data!
Loading plot first!
Okay, this is more impressive non-log transformed and side by side.
The F2 sample set was higher signal throughout, remember. Check out how much closer they are on the right when normalized on my 129 boring proteins! Yeah!
Remember, the best part about this (amazing!) test dataset is that we have the same sample in both datasets in channel 117 (highlighted above!)
If I take the reporter ion intensity from each F1: 117 and divide it by F2:117 (non-normalized) and then average the ratio across all proteins, the ratio you get is 3.30.
If I do the exact same thing after normalizing on my 129 exceedingly boring proteins, the average ratio is 1.12 ~ just about what it ought to be!


No comments:
Post a Comment